GSoC Phase1: Timeless Debugger Update
GSoC (Google Summer of Code) Phase1 has been finished. This post is to outline the work completed during
the Phase1 period and show you an overview of radare2 Timeless Debugger.
Project link: Timeless Debugging Support for radare2 project
Timeless Debugger
To illustrate the architecture of r2 Timeless Debugger, Firstly I need to explain, “What is Timeless Debugging?”.
Timeless Debugging is a new paradigm of debugging, that is very similar to Reverse debugging or Record and Replay. It observes a binary at any point of its execution state by saving entire execution log. For example, QIRA execute every operations, like mov rax, [0x1000] by QEMU and records each logs like, Write [0x1000] to rax. After all recordings, user can restore each program states at any point of binary by using these records.
r2 Timeless Debugger
In GSoC term, I’m working on full scratch implementation of r2 Timeless Debugger.
This section show you an overview of r2 Timeless Debugger and what I have done during the past four weeks.
Record and Replay
The architecture of r2 Timeless Debugger is fundamentally based on traditional debugging concept, Record and Replay (RnR). In RnR, firstly you need to run debuggee process and record non-deterministic behavior.
NOTE: Only non deterministic events need to be recorded, because deterministic events can be reproduced by running actual program.
After that, you can restore execution state at any point of the program. That’s how, traditional RnR functions like, reverse-next or reverse-continue of gdb are working correctly.
r2 Record and Replay
At first, I’ve implemented r2 recording functions for deterministic events. r2 has now new command dts, that saves current state of memory and register (named “trace session”). And you can also use new command dsb for debug step back, same as reverse-next in gdb, by restoring previous trace session saved by dts and execute forward from it to desired point. That’s how all deterministic events can be replayed and seek program counter one step to backward correctly.
Now Let’s see the actual usage.
At first, you need to save trace session at any points you like by dts+ command.
[0x7f985aaaacc0]> db main
[0x7f985aaaacc0]> dc
Selecting and continuing: 17635
hit breakpoint at: 40053c
hit breakpoint at: 400526
[0x00400526]> pd 15 @main
            ;-- main:
            ;-- main:
            ;-- rax:
            ;-- rip:
            0x00400526 b    55             push rbp
            0x00400527      4889e5         mov rbp, rsp
            0x0040052a      c705080b2000.  mov dword [obj.test], 0xff  ; [0x60103c:4]=0
            0x00400534      8b05020b2000   mov eax, dword [obj.test]   ; [0x60103c:4]=0
            0x0040053a      89c6           mov esi, eax
            0x0040053c      bfe4054000     mov edi, str.Hello_World__d_n ; 0x4005e4 ; "Hello World %d\n"
            0x00400541      b800000000     mov eax, 0
            0x00400546      e8b5feffff     call sym.imp.printf
            0x0040054b      b800000000     mov eax, 0
            0x00400550      5d             pop rbp
            0x00400551      c3             ret

[0x00400526]> dts+
Reading 4096 bytes from 0x00601000...
Reading 8192 bytes from 0x7ff5c67d6000...
Reading 16384 bytes from 0x7ff5c67d8000...
Reading 12288 bytes from 0x7ff5c69d5000...
Reading 8192 bytes from 0x7ff5c69ff000...
Reading 4096 bytes from 0x7ff5c6a02000...
Reading 4096 bytes from 0x7ff5c6a03000...
Reading 139264 bytes from 0x7ffcea3ee000...
OK. Now, a trace session at 0x00400526 point is saved. You can seek back and forward in the code area after this address.
[0x00400526]> db 0x00400550
[0x00400526]> dc
Selecting and continuing: 23408
Hello World 255
hit breakpoint at: 400550
[0x00400550]> dr rip
0x00400550              # Now pc is at 0x00400550
[0x00400550]> dsb       # Debug step back
execute from 0x00400526 to 0x00400550
Hello World 255
hit breakpoint at: 40054b
[0x0040054b]> dr rip
0x0040054b              # Success! rip is seeked forward. (Other state too of course.)
Diff-style format for recording
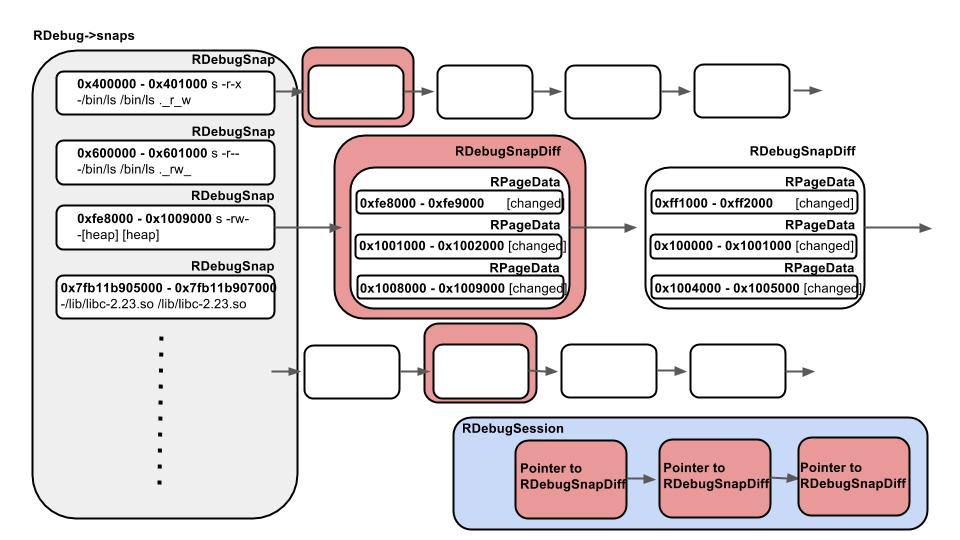
Trace session can saved any time you like by dts+. Each session have memory and register state at the point in which it’s saved. dts+ command doesn’t save entire memory dump for each session. Instead, it saves only different memory pages from previous trace session, called diff-style format.
(Trace session architecture internal.)
Let’s see this feature.
You can use dts command to show the all list of trace sessions.
(Using same program above.)
[0x7fb11b90bcc0]> db 0x00400550
[0x7fb11b90bcc0]> db main
[0x7fb11b90bcc0]> dc
Selecting and continuing: 23742
hit breakpoint at: 400526
[0x00400526]> dts+                        # Save first session at 0x400526
Reading 4096 bytes from 0x00601000...
Reading 8192 bytes from 0x7fb11b905000...
Reading 16384 bytes from 0x7fb11b907000...
Reading 12288 bytes from 0x7fb11bb04000...
Reading 8192 bytes from 0x7fb11bb2e000...
Reading 4096 bytes from 0x7fb11bb31000...
Reading 4096 bytes from 0x7fb11bb32000...
Reading 139264 bytes from 0x7ffdec7e7000...
[0x00400526]> dc
Selecting and continuing: 23742
Hello World 255
hit breakpoint at: 400550
[0x00400526]> dts+                        # Save second session at 0x400550
Reading 135168 bytes from 0x00fe8000...
[0x00400526]> dts                         # Show the list of trace sessions
session: 0   at:0x00400526
session: 1   at:0x00400550
  - 0 0x00601000 - 0x00602000 size: 4096 (pages: 0 )
  - 1 0x7fb11b905000 - 0x7fb11b907000 size: 8192 (pages: 0 1 )
  - 2 0x7fb11b907000 - 0x7fb11b90b000 size: 16384 (pages: 0 )
  - 3 0x7fb11bb04000 - 0x7fb11bb07000 size: 12288 (pages: 1 )
  - 4 0x7fb11bb31000 - 0x7fb11bb32000 size: 4096 (pages: 0 )
  - 5 0x7ffdec7e7000 - 0x7ffdec809000 size: 139264 (pages: 31 32 )
As you can see the result of dts, session 1 saves only different pages from previous session 0.
It saves memory space.
Checkpoint
If you run dsb command just after long loop, you would find that perfomance become very slow. :(
So I’ve implemented simple checkpoint system, that can automatically save trace sessions among long execution.
But it’s WIP and feature work…
Next phase
Following tasks are what’s in for the upcoming weeks.
- Write more tests for
dsb - Export trace sessions as a database
- Add debug continue back command
dcb