GSoC Final: radare2 Timeless Debugger
GSoC has almost been finished. I would like to summarize my works: how did I tackle with and what I’ve done. If You are interested in this new feature, I recommend you to read the document radare2 Timeless (Reverse) Debugger
What is Timeless Debugger?
Timeless Debugging is a debugging paradigm, which is very similar to Reverse debugging or Record and Replay. In general, almost all debugger can control program counter of debuggee process forward by similar commands, like run, continue and stepover… Moreover some rich debugger, like gdb, have also ability to seek program counter backward by stepback, continueback commands. This feature is called Reverse debugging and very usefull when you have missed some debuggee’s activities. You can find what is missed by seeking backward and recovering state. However, radare2 had not have this feature before.
Basic concepts
In GSoC term, I’m working on implementation of r2 Timeless(Reverse) Debugger.
The architecture of r2 Timeless Debugger is fundamentally based on traditional debugging concept, Record and Replay (RnR). In RnR, at first you need to run debuggee process and record non-deterministic behavior.
NOTE: Only non deterministic events need to be recorded, because deterministic events can be reproduced by running actual program.
At the beginning
Before GSoC beginning, I’ve added simple record and replay system for radare2.
A new command dts+ can save entire program state, like register and memory dump then,
another new command dsb can replay until the before address from current pc.
i.e. You can single step back from current pc.
Internally, dsb command restores program state from the record previously saved by dts+,
and then, run program from there to desired point.
That’s how program counter can be seeked backward. You can try step backing like:
[0x7fa9171ffcd0]> dcu main
Continue until 0x00400536 using 1 bpsize
hit breakpoint at: 400536
[0x00400536]> pd 5
            0x00400536      55             push rbp
            0x00400537      4889e5         mov rbp, rsp
            0x0040053a      bfd4054000     mov edi, str.Hello_World    ; 0x4005d
4 ; "Hello World"
            0x0040053f      e8ccfeffff     call sym.imp.puts
            0x00400544      b800000000     mov eax, 0
[0x00400536]> dts+      # Record program state at that point
[0x00400536]> 3dso
[0x00400536]> dr rip
0x0040053f              # Current PC is here
[0x00400536]> dsb       # Let's step back!
[0x00400536]> dr rip
0x0040053a              # Success. PC is step backed!
[0x00400536]> dsb
[0x00400536]> dr rip
0x00400537              # Again
[0x00400536]> dsb
[0x00400536]> dr rip
0x00400536              # And again...
It works fine, but, program records are implmented as entire memory and register dump. When you record program states at many times, there are many large dumps in memory.
So, during the community bonding period, My works are mainly focused on Reducing size of program records.
Diff-style format for recording
Program records are used to restore before state. So it’s not necessary to hold entire dump.
Only different pages from a previous record are enough for restoring.
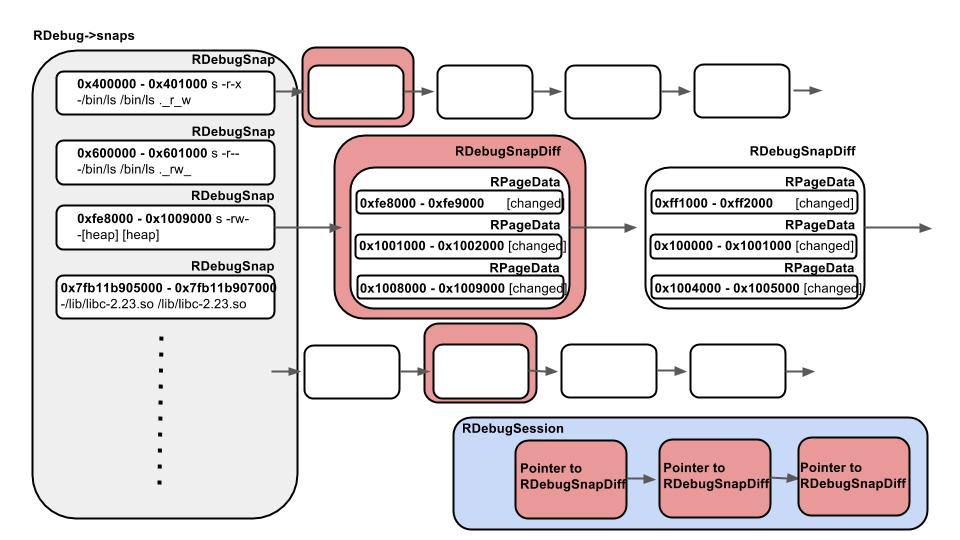
So I’ve added new diff style recording format, which saves only changed memory area
from previous recording point.
Architecture overview is as shown in the figure.
(Trace session architecture internal.)
OK. Let’s see this feature.
You can use dts command to show the all list of program records.
[0x7fb11b90bcc0]> dcu main
Selecting and continuing: 23742
hit breakpoint at: 400526
[0x00400526]> dts+                        # Save first session
[0x00400526]> 10dso
[0x00400526]> dts+                        # Save second session(saved only changed area)
Reading 135168 bytes from 0x00fe8000...
[0x00400526]> dts                         # Show the list of trace sessions
session: 0   at:0x00400526
session: 1   at:0x00400550
  - 0 0x00601000 - 0x00602000 size: 4096 (pages: 0 )
  - 1 0x7fb11b905000 - 0x7fb11b907000 size: 8192 (pages: 0 1 )
  - 2 0x7fb11b907000 - 0x7fb11b90b000 size: 16384 (pages: 0 )
  - 3 0x7fb11bb04000 - 0x7fb11bb07000 size: 12288 (pages: 1 )
  - 4 0x7fb11bb31000 - 0x7fb11bb32000 size: 4096 (pages: 0 )
  - 5 0x7ffdec7e7000 - 0x7ffdec809000 size: 139264 (pages: 31 32 )
As you can see the result of dts, session 1 saves only different pages from previous session 0.
Checkpoint
If you run dsb command just after long loop, you would find that perfomance become very slow. :(
So after GSoC Phase1 began, I’ve implemented simple checkpoint system, that can automatically save trace sessions among long execution. And fixed some bugs related to record and replay functions.
Optional features
After Phase2 began, I’ve added optional feature for recorder. At first I’ve added Import/Export
function of program records. When you take some records and want to export these to filesystem, you can
use dtst <filename>. Default export path is current directory. It can be changed by e dir.dbgsnap=<path>. And of course, you can import these records from filesystem like dtsf <filename>.
[0x004028c2]> dtst records_for_test
Session saved in records_for_test.session and dump in records_for_test.dump
[0x004028c2]> dtsf records_for_test
session: 0, 0x4028a0 diffs: 0
session: 1, 0x4028c2 diffs: 0
After that, I’ve also implmented dts- and dtsC commands, delete and add comment for specified record like:
[0x004028c2]> dtsC 0 program start
[0x004028c2]> dtsC 1 decryption start
[0x004028c2]> dts
session: 0   at:0x004028a0   "program start"
session: 1   at:0x004028c2   "decryption start"
Debug continue back
Program recording and reverse single step function has almost completed. So next, I’ve challeged to add
continue back command, dcb. Basic usage is same as single step back dsb, but it can seek program counter backward until hit breakpoint. So it’s reverse version of continue.
Let’s try this feature like:
[0x004028a0]> db 0x004028a2 # Break at 0x4028a2
[0x004028a0]> 10dso
[0x004028a0]> dr rip
0x004028b9                  # Step out 10 times
[0x004028a0]> dcb           # Continue back until last breakpoint
[0x004028a0]> dr rip
0x004028a2                  # Now backed to 0x4028a2
Reverse debugger for ESIL
According to resume, my works in phase2 has almost finished, but there are plenty of time until finish of phase2. So I’ve developed reverse debugger for ESIL. In ESIL mode, you can record ESIL program state by a new command aets+ and step one back by aesb command.
Yes. It’s same as dts+ and dsb in normal debug mode.
You can try these feature under ESIL mode like:
[0x00404870]> aets+     # Record ESIL program state
[0x00404870]> aer rip
0x00404870
[0x00404870]> 5aeso
[0x00404870]> aer rip
0x0040487d
[0x00404870]> aesb     #  Step back under ESIL mode
[0x00404870]> aer rip
0x00404879             #  Success!
Watchpoint
At Final phase, I was working mainly watchpoint function. It’s efficient feature when use with reverse debugging. For example, when you want to observe some variables changes, you can set watchpoint on it and reverse debug to find where the variable has changed.
You can use dbw <addr> <r/w> command to set watchpoint at address like:
[0x7f805e86bcd0]> dbw 0x00400537 w
[0x7f805e86bcd0]> drx       # watchpoint is implmented as hardware breakpoint
* dr0 Gw 0x00400537 2
- dr1 Lx 0x00000000 1
- dr2 Lx 0x00000000 1
- dr3 Lx 0x00000000 1
- dr6 Lx 0x00000000 1
- dr7 Lx 0x00010001 1
[0x7f805e86bcd0]> dc
Continue until 0x00400536 using 1 bpsize
hit breakpoint at: 400536
[0x00400536]>
Moreover, you can set conditional watchpoint like:
[0x7f60fa998cd0]> (break_rax,f reg_rax=`dr rax`,f test=`?vi reg_rax-0x31c0`,?= $
est)
[0x7f60fa998cd0]> dbwC 0x00400537 .(break_rax)  # break only rax==0x31c0
[0x7f805e86bcd0]> dbw 0x00400537 w
[0x7f805e86bcd0]> dc
Hello World
Tests
Of course I’ve wrote tests for above new features. Currently these tests are for Linux x86-64 environment. If someone find strange bug under other environments, plz report a issue.
Thanks
Finally, I would like to thanks people:
- radare community
- My mentors, pancake and Álvaro Felipe
- The GSoC organization
GSoC has been finished, but I’d like to continue to develop for r2!
Thank you.